Image Details
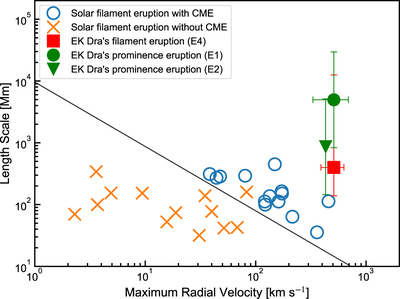
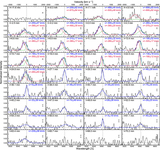
Caption: Figure 21.
Comparison between the velocity (﹩{V}_{{\rm{r}}\_\max }﹩) and length scale (L) of filament/prominence eruptions on the Sun and G-dwarf EK Dra. The blue circles and orange crosses indicate the solar filament eruptions with and without CMEs, respectively. The green and red points correspond to the stellar prominence and filament eruptions on EK Dra, respectively (this study, Namekata et al. 2022d). The stellar data are the maximum line-of-sight velocities while the solar data are maximum radial velocity. The solid black line indicates an empirical solar threshold that can roughly distinguish whether a filament eruption is associated with CMEs or not in the formula of (﹩{V}_{{\rm{r}}\_\max }﹩/100 km s−1)(L/100 Mm)0.96 = 0.8 (Seki et al. 2021).
Other Images in This Article

Show More
Copyright and Terms & Conditions
© 2024. The Author(s). Published by the American Astronomical Society.