Image Details
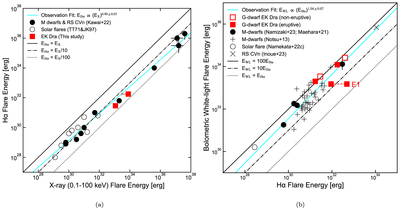
Caption: Figure 18.
Relations between Hα, X-ray, and white-light energies for solar and stellar flares. Left: the relation between Hα and bolometric X-ray energies (0.1–100 keV = 0.124–124 Å). Data of superflares on the G-dwarf EK Dra detected in this study are represented by red squares. Other solar and stellar data are taken from Kawai et al. (2022). The function fitted to the observational data with a power law is shown by the cyan line. Right: the relation between bolometric white-light and Hα energies. Data of superflares on the G-dwarf EK Dra, which are associated with filament/prominence eruptions, are represented by filled red squares, whereas those without eruptions are represented by open red squares (this study, Namekata et al. 2022c; Namekata et al. 2022d). For E1, the total energy, including the blueshift component, is plotted as the upper limit, with the radiative energy of the central component from the two-component fit being plotted as the lower limit. Data of M-dwarf flares are taken from Maehara et al. (2021), Namizaki et al. (2023), and Notsu et al. (2023). Solar flare data are taken from Namekata et al. (2022a). The function fitted to the observational data, excluding flare E1, with a power law is shown by the cyan line.
Other Images in This Article

Show More
Copyright and Terms & Conditions
© 2024. The Author(s). Published by the American Astronomical Society.