Image Details
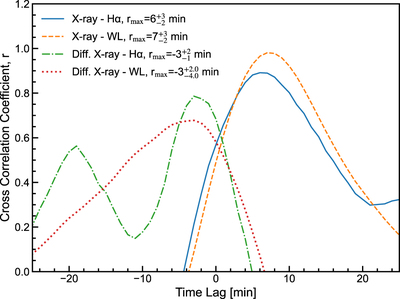
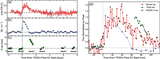
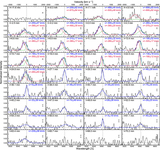
Caption: Figure 17.
The cross-correlation coefficients for different lag times among light curves for the superflare on 2022 April 17 (E3). The time lags of maximum correlation coefficients, ﹩{r}_{\max }﹩, is defined as the most likely value. The 90th percentile gives the lag time uncertainty. The time delay of X-ray against Hα is ﹩{6}_{-2}^{+3}﹩ minutes, the time delay of X-ray against WL is ﹩{7}_{-2}^{+3}﹩ minutes, the time delay of differential X-ray against Hα is −3﹩{}_{-2}^{+1}﹩ minutes, and the time delay of differential X-ray against WL is −3﹩{}_{-4}^{+2}﹩ minutes. See Tristan et al. (2023) for the method.
Other Images in This Article

Show More
Copyright and Terms & Conditions
© 2024. The Author(s). Published by the American Astronomical Society.