Image Details
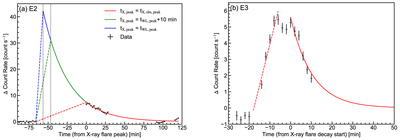
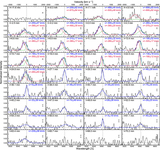
Caption: Figure 16.
Fitting results of the X-ray light curves for superflares E2 (a) and E3 (b). The decay phase is fitted with an exponential function (colored solid lines), and the rise phase with a linear function (colored dashed lines), using curve_fit. (left) For flare E2, two patterns of light-curve extrapolation are presented: assuming the peak time is the same as that of the white light (blue), and assuming the peak time is delayed by 10 minutes compared with the white light. The X-ray peak of flare E2 could possibly be higher by a factor of 4.2 (green) and 5.7 (blue) than the observed peak. The X-ray energy of flare E2 could possibly be higher by a factor of 2.7 (green) and 3.2 (blue) than the observed energy.
Other Images in This Article

Show More
Copyright and Terms & Conditions
© 2024. The Author(s). Published by the American Astronomical Society.