Image Details
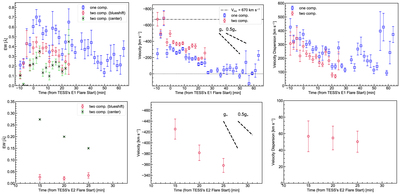
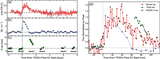
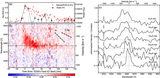
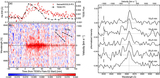
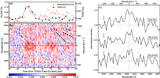
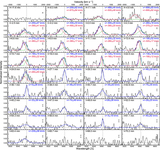
Caption: Figure 11.
Temporal evolution of the blueshifted emission line components for (upper) flare E1 on 2022 April 10 and (lower) superlare E2 on 2022 April 16. Left: Temporal variation in EW (note that positive values mean emissions); middle: temporal variation in velocity; right: temporal variation in velocity dispersion (Gaussian’s standard deviation σ). The blue squares represent the result of fitting with a one-component Gaussian, while the red and green lines represent the blueshifted component and the central component, respectively, from the two-component Gaussian fit.
Other Images in This Article

Show More
Copyright and Terms & Conditions
© 2024. The Author(s). Published by the American Astronomical Society.
Copyright ©
2025 Astronomy Image Explorer. All Rights Reserved.