Image Details
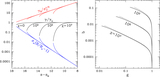
Caption: Figure 3.
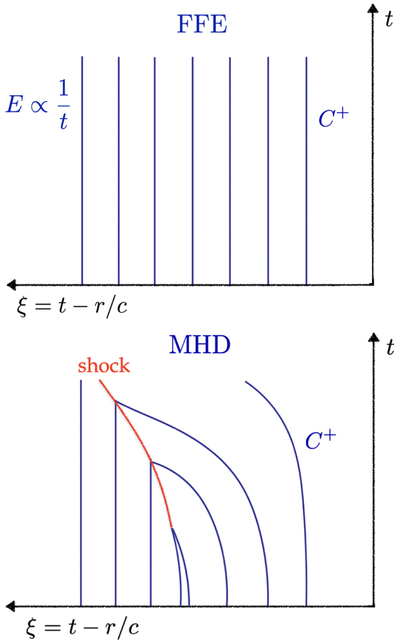
Schematic illustration of the flow of characteristics C + in FFE and MHD, shown in the t–ξ plane. Each C + has its initial position ξ i and carries a value of ﹩K({\xi }_{{\rm{i}}})={rE}/\mu ﹩ determined by the initial wave profile. In the FFE limit, the characteristics are vertical straight lines; they propagate with speed β + = 1, which corresponds to d ξ +/dt = 0. The MHD correction to FFE implies d ξ +/dt = 1 − β + ≠ 0, so the C + characteristics are no longer static in ξ; they become significantly bent in the region where E 2 approaches B 2, leading to the formation of a shock (red curve).
Other Images in This Article
Copyright and Terms & Conditions
© 2023. The Author(s). Published by the American Astronomical Society.