Image Details
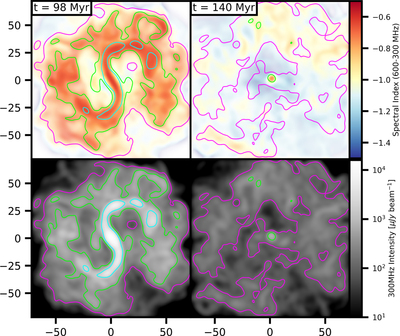
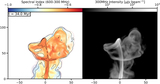
Caption: Figure 5.
Top panels: radio spectral index (600–300 MHz, cut at 100 μJy beam−1 at 300 MHz) with 300 MHz radio brightness contours (levels = [100, 400, 1600] μJy beam−1) for the P32A30 simulation at 98 Myr (left) and 140 Myr (right) both viewed from above the jet precession axis (θ = 0°). Bottom panels: 300 MHz radio brightness at the same times. Radio images are convolved to 11.775″ FWHM resolution. The jet turns off at 100 Myr and the plasma is allowed to cool radiatively. In the online version, a two-panel animated figure (10 seconds) follows the evolution of the source from the beginning of the simulation at 2 Myr until t = 160 Myr.
(An animation of this figure is available.)
The video/animation of this figure is available in the online journal.
Other Images in This Article
Copyright and Terms & Conditions
© 2023. The Author(s). Published by the American Astronomical Society.