Image Details
Caption: Figure 4.
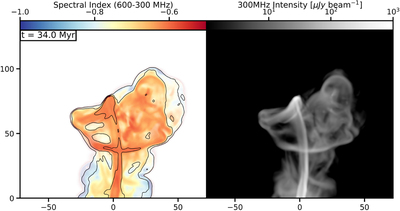
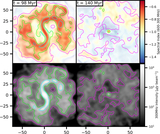
Left: radio spectral index (600–300 MHz, weighted by 300 MHz intensity with 300 MHz radio brightness contours (levels = [1, 10, 100] μJy beam−1) for the P32A30 simulation at t = 34 Myr. Right: 300 MHz radio brightness at the same time. Radio images are convolved to 2.355″ FWHM resolution. At this time, the jet is undergoing a “jet reorientation event” in which the jet trajectory changes by more than 90° over about 2.5 Myr. This can be seen here as the very sharp bend at the tip of the jet head at coordinates (x, y) ≈ (−5, 80) kpc. In the online version, an animated figure (17 seconds) shows the full duration of the reorientation event from t = 0.2 Myr until t = 40 Myr.
(An animation of this figure is available.)
The video/animation of this figure is available in the online journal.
Other Images in This Article
Copyright and Terms & Conditions
© 2023. The Author(s). Published by the American Astronomical Society.