Image Details
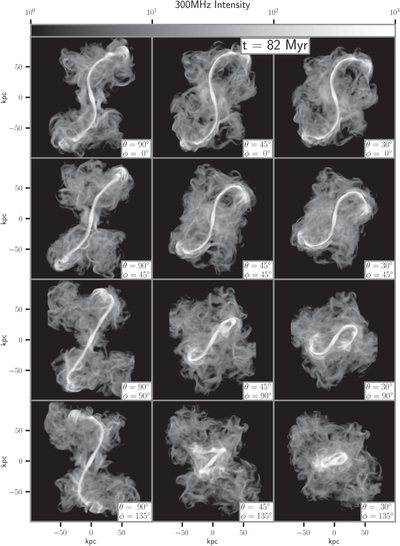
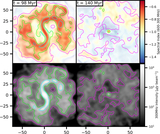
Caption: Figure 3.
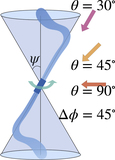
Radio intensity at 300 MHz for the P32A30 simulation at t = 82 Myr from a variety of viewing angles. Radio images are convolved to 2.355″ FWHM resolution. Viewing angles are listed in the inset for each panel. For ease of visualization, the polar viewing angles are included in the diagram in Figure 1. The polar angle is varied by column while the azimuthal angle is varied by row. In the online version, an animated figure is available (8 s, spanning 100 Myr simulation time) that follows the evolution of the source from each viewing angle simultaneously.
(An animation of this figure is available.)
The video/animation of this figure is available in the online journal.
Other Images in This Article
Copyright and Terms & Conditions
© 2023. The Author(s). Published by the American Astronomical Society.