Image Details
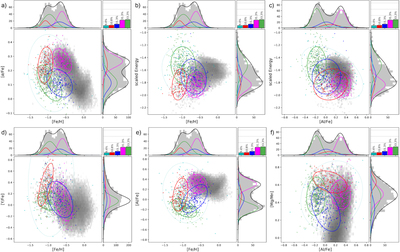
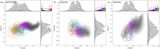
Caption: Figure 3.
Distribution of the Galaxy’s eccentric populations in chemodynamical spaces similar to Figure 2 but with the GALAH–Gaia sample. For the GALAH–Gaia sample 12-dimensional chemodynamical space is used for the GMM and the projections corresponding to Figure 2 are shown. The GS/E component is marked with green (see Section 4 for more details). Panel (d) shows [Y/Fe] vs. [Fe/H].
Other Images in This Article
Copyright and Terms & Conditions
© 2022. The Author(s). Published by the American Astronomical Society.
Copyright ©
2025 Astronomy Image Explorer. All Rights Reserved.