Image Details
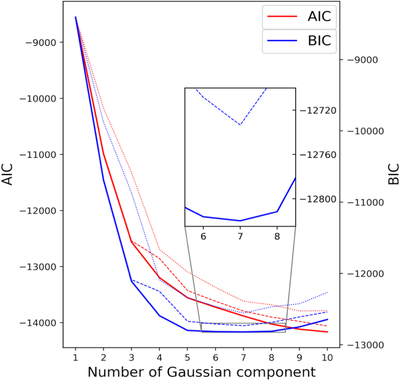
Caption: Figure 1.
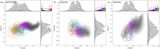
Red (blue) curves show AIC (BIC) performance for the APOGEE sample as a function of the number of Gaussian components. For each number of components, the GMM fit is performed a large number of times starting from random initial conditions to ensure convergence and to investigate scatter in obtained solutions. For each number of components probed, the solid line gives the lowest (best) AIC/BIC score, the dashed line corresponds to the median, and the dotted line corresponds to the highest score. The BIC test indicates the GMM with seven Gaussian components as the optimal case. The zoom-in panel shows the BIC result around the best score.
Other Images in This Article
Copyright and Terms & Conditions
© 2022. The Author(s). Published by the American Astronomical Society.