Image Details
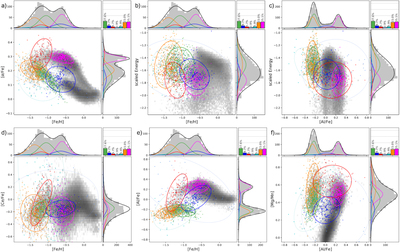
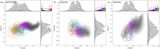
Caption: Figure 2.
Distribution of the Galaxy’s eccentric populations in APOGEE–Gaia sample in chemodynamical spaces. The GMM identified components are marked with 2σ ellipses. The Splash and Aurora are marked with magenta and red, respectively. The GS/E (GS/E1 and GS/E2 enclosing the metal-richer and metal-poorer portion) components are marked with green and yellow. Eos is marked with blue. Two background components with low weight and no clear physical trend are marked with cyan and navy. The modeled distribution for each component and the total sum (black line) is marked with a one-dimensional histogram along each dimension at the top and the right side of each panel, together with the background histogram marking the distribution of the stars used for the GMM. The weight of each component is marked in the upper right corner of each panel. The two-dimensional density histogram of the whole APOGEE–Gaia data set is shown as a grayscale background as a reference. Each panel shows a different two-dimensional projection of the original six-dimensional chemodynamical space used for the GMM: (a) [α/Fe] vs. [Fe/H]; (b) scaled energy vs. [Fe/H]; (c) scaled energy vs. [Al/Fe]; (d) [Ce/Fe] vs. [Fe/H]; (e) [Al/Fe] vs. [Fe/H]; (f) [Mg/Mn] vs. [Al/Fe].
Other Images in This Article
Copyright and Terms & Conditions
© 2022. The Author(s). Published by the American Astronomical Society.