Image Details
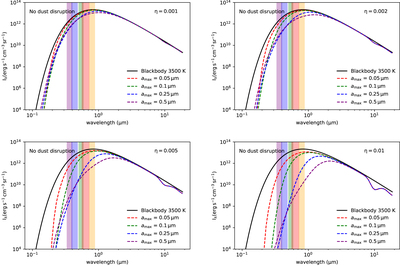
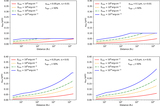
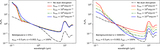
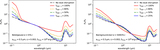
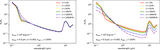
Caption: Figure 12.
The reddened spectra by CSE dust grains with the variation of ﹩{a}_{\max }﹩ without RAT-D (dashed colored lines). Compared with the intrinsic intensity (solid black line), the spectra are more attenuated by large grains from UV to NIR wavelengths. Rectangular boundaries illustrate the photometric bands (see Table 2 in the Appendix B).
Other Images in This Article


Show More
Copyright and Terms & Conditions
© 2022. The Author(s). Published by the American Astronomical Society.
Copyright ©
2025 Astronomy Image Explorer. All Rights Reserved.