Image Details
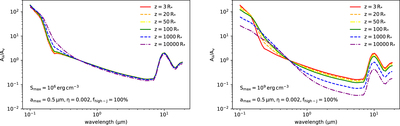
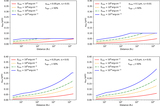
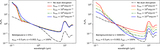
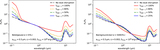
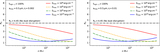
Caption: Figure 9.
Same as Figure 7 but for different LOS z, assuming ﹩{S}_{\max }={10}^{6}\,\mathrm{erg}\,{\mathrm{cm}}^{-3}﹩ (left panel) and ﹩{S}_{\max }={10}^{9}\,\mathrm{erg}\,{\mathrm{cm}}^{-3}﹩ (right panel). The original dust with ﹩{a}_{\max }=0.5\,\mu {\rm{m}}﹩, η = 0.002, and f high-J = 100% is adopted. The extinction curve is steeper when observing at lower z.
Other Images in This Article


Show More
Copyright and Terms & Conditions
© 2022. The Author(s). Published by the American Astronomical Society.
Copyright ©
2025 Astronomy Image Explorer. All Rights Reserved.