Image Details
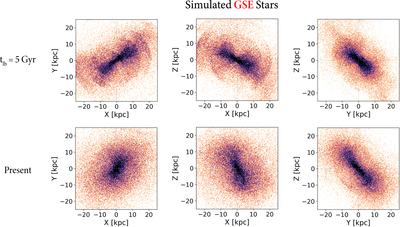
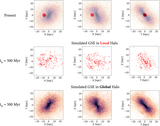
Caption: Figure 2.
2D histograms of the simulated Gaia–Sausage–Enceladus (GSE) stellar distribution in N21 in three projections, adopting an asinh stretch that is normalized to include 98% of the sample. All following figures with 2D histograms adopt the same color scheme. The top and bottom panels show the stellar distribution at lookback time t lb = 5 Gyr and present day, respectively. These panels show that the tilt in the stellar distribution of the simulated GSE persists over 5 Gyr.
Other Images in This Article
Copyright and Terms & Conditions
© 2022. The Author(s). Published by the American Astronomical Society.
Copyright ©
2025 Astronomy Image Explorer. All Rights Reserved.