Image Details
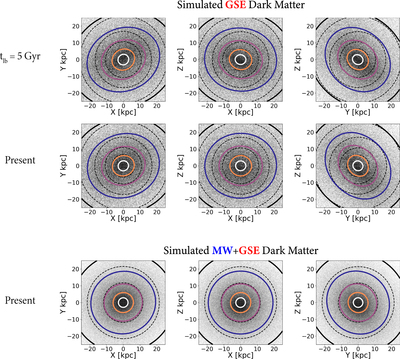
Caption: Figure 1.
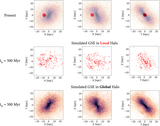
2D histograms of the dark matter (DM) distribution in the fiducial simulation of N21. We adopt a grayscale with asinh stretch that is normalized to include 98% of the sample. Overplotted in solid lines are equipotential contours in logarithmic spacing, and dashed lines are corresponding contours of a spherical potential to guide the eye. Top and middle panels show DM from the simulated Gaia–Sausage–Enceladus (GSE) at lookback time t lb = 5 Gyr and present day, respectively. These panels demonstrate that the DM distribution of GSE is tilted and stable over the last 5 Gyr. Bottom panels show the combined DM distribution of the simulated GSE and the Milky Way (MW).
Other Images in This Article
Copyright and Terms & Conditions
© 2022. The Author(s). Published by the American Astronomical Society.