Image Details
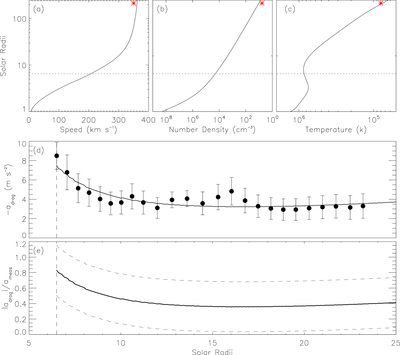
Caption: Figure 4.
(a)–(c) Variation of the simulated proton speed, number density, and temperature of the solar wind with heliocentric distance, compared with the in situ observational data at 1 au (red asterisks). The horizontal dotted line indicates the distance of 6.5 R ⊙. (d) a drag in the drag-based model by using the speed of the CME front based on discrete height–time measurements (filled circle) and a quadratic fit to the height–time measurements (solid curve). (e) Ratio of ∣a drag∣ to a meas. The two dashed curves indicate the lower and upper uncertainties. The vertical dashed lines in panels (d) and (e) indicate the height at 6.5 R ⊙.
Other Images in This Article


Copyright and Terms & Conditions
© 2022. The Author(s). Published by the American Astronomical Society.