Image Details
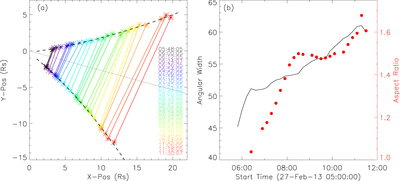
Caption: Figure 3.
(a) Variation of the lateral width of the CME at different times in the X–Y plane. The black solid line indicates the position angle of 255°, and the two curves show the quadratic fit to the X–Y data points. (b) Variation of the angular width of the CME (black) and the aspect ratio (red).
Other Images in This Article


Copyright and Terms & Conditions
© 2022. The Author(s). Published by the American Astronomical Society.
Copyright ©
2025 Astronomy Image Explorer. All Rights Reserved.