Image Details
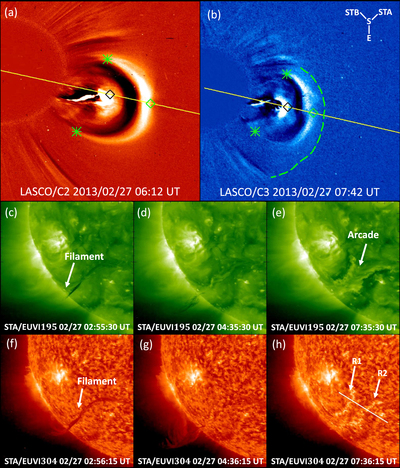
Caption: Figure 1.
CME eruption on 2013 February 27. (a), (b) Running-difference images of the CME in LASCO C2 and C3 at two different times. The yellow line indicates the position angle used for the height measurement, the black and green diamonds indicate the CME core and front, and the two green asterisks mark the two lateral points. In panel (b), the dashed green curve indicates the shock front, and the inset shows the positions of STEREO-A and STEREO-B relative to the Sun (S) and Earth (E). Panels (a) and (b) show heliocentric distance ranges of 1–6 R ⊙ and 1–17 R ⊙, respectively. (c)–(h) Observations of STEREO-A/EUVI at 195 ﹩\mathring{{\rm{A}}}﹩ and 304 ﹩\mathring{{\rm{A}}}﹩. The solid line in panel (h) refers to the position of the superposed slit.
Other Images in This Article

Copyright and Terms & Conditions
© 2022. The Author(s). Published by the American Astronomical Society.