Image Details
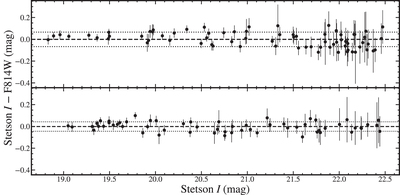
Caption: Figure C1.
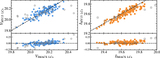
Comparison between Stetson I and HST F814W for the two IMACS pointings that overlap with the HST/ACS/F814W imaging. The top panel contains 73 comparison stars and the bottom 61 stars. The black dashed lines correspond to the mean offset and the black dotted lines are the 1σ standard deviation. The top plot has a difference of <0.001 ± 0.066 mag and the bottom plot has a difference of −0.001 ± 0.043 mag between Stetson ground-based I band and HST F814W magnitudes.
Other Images in This Article


Show More
Copyright and Terms & Conditions
© 2022. The Author(s). Published by the American Astronomical Society.
Copyright ©
2025 Astronomy Image Explorer. All Rights Reserved.