Image Details
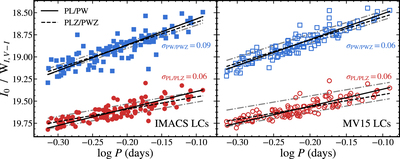
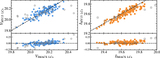
Caption: Figure 7.
RRab period–luminosity relations based on the new IMACS light curves (LCs; left) vs. literature LCs (right) from (Martínez-Vázquez et al. 2015, MV15). Both sets of mean magnitudes were determined using TMMT-template fits to the LCs. PL relations are shown in I 0 (red circles) and W I,V−I (blue squares). Solid lines are best-fit PL/PW relations and dotted lines are the best-fit PLZ/PWZ relations (slopes and metallicity terms adopted from Neeley et al. 2019). Dotted gray lines are shown to represent the full range of metallicity considered. The MV15 LC I-band PL relation (right) exhibits a smaller scatter than the IMACS equivalent (left) due to the higher sampling rate in their LCs. The results when using either the new IMACS LCs or the MV15 LCs are in agreement with each other (see Section 4.2).
Other Images in This Article


Show More
Copyright and Terms & Conditions
© 2022. The Author(s). Published by the American Astronomical Society.