Image Details
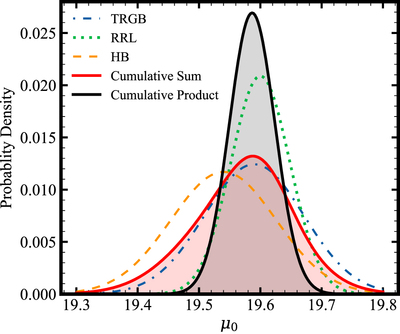
Caption: Figure 9.
Overview of TRGB (blue dashed–dotted), RRL PWZ (green dotted), and HB (orange dashed) distances. Also shown are two approaches to potentially combining the measurements: a product distribution (black curve) and sum distribution (red curve).
Other Images in This Article


Show More
Copyright and Terms & Conditions
© 2022. The Author(s). Published by the American Astronomical Society.
Copyright ©
2025 Astronomy Image Explorer. All Rights Reserved.