Image Details
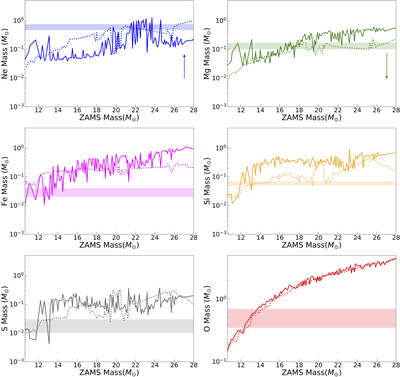
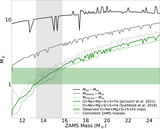
Caption: Figure 9.
The curves represent the total elemental masses (excluding the NS) as a function of the ZAMS mass, based on the CC models of Jacovich et al. (2021; solid lines) and Sukhbold et al. (2016; dotted lines). We note that these models overpredict the Mg and underpredict the Ne masses (see Section 4.1), with the colored arrows indicating in which direction the curves would be expected to shift in a more realistic scenario. The colored bands represent the elemental masses measured from X-ray observations of G292.0+1.8 by Bhalerao et al. (2019).
Other Images in This Article


Copyright and Terms & Conditions
© 2022. The Author(s). Published by the American Astronomical Society.
Copyright ©
2026 Astronomy Image Explorer. All Rights Reserved.