Image Details

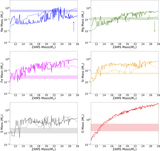
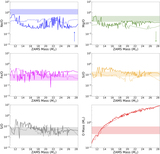
Caption: Figure 8.
The total ejecta mass (black curve), He core mass (dark gray curve), and CO core mass (light gray curve) as a function of the ZAMS mass for the single-star CC models of Jacovich et al. (2021). The green curve represents the total mass of O, Ne, Mg, Si, S, and Fe inside the He core as a function of the ZAMS mass. All curves exclude the NS mass. The horizontal green band indicates the total X-ray-measured mass of O, Ne, Mg, Si, S, and Fe, including the uncertainties (Bhalerao et al. 2019). The gray vertical band marks the corresponding range of consistent ZAMS masses.
Other Images in This Article


Copyright and Terms & Conditions
© 2022. The Author(s). Published by the American Astronomical Society.
Copyright ©
2026 Astronomy Image Explorer. All Rights Reserved.