Image Details
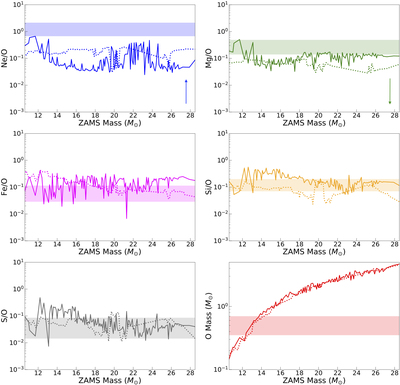
Caption: Figure 10.
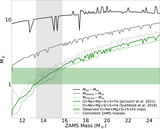
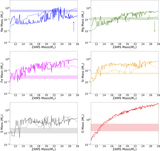
The curves represent the elemental mass ratios (after the subtraction of the NS mass) as a function of the ZAMS mass, based on the CC models of Jacovich et al. (2021; solid lines) and Sukhbold et al. (2016; dotted lines). We note that since these models overpredict the Mg and underpredict the Ne masses (see Section 4.1), the Mg/O curve would move down and the Ne/O curve would move up, as indicated by the colored arrows. The colored bands represent the elemental mass ratios as measured from X-ray observations by Bhalerao et al. (2019). A ZAMS mass of around 13 M ⊙ gives abundance ratios that are roughly consistent with the total oxygen mass in the last panel and the measured ratios of Fe, Si, and S with respect to oxygen.
Other Images in This Article


Copyright and Terms & Conditions
© 2022. The Author(s). Published by the American Astronomical Society.