Image Details

Caption: Figure 8.
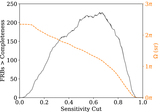
Diagnostic plots for Bayesian biased coin-flip tests performed for a variety of sensitivity cuts. Top panel: the sky is partitioned into high and intermediate latitudes at ∣b∣ = 15°—ratios between these regions are shown for both the detections (solid line) and the exposure (dashed line). The shaded region is a 2σ band derived from an ensemble of simulated “coin flips,” where each mock includes the same number of events as the observed sample and is generated from a binomial distribution with bias specified by the exposure ratio. Bottom panel: associated Bayes factor for each sensitivity cut (solid line), along with common significance thresholds (dashed lines), with “strong” evidence for isotropy at a Bayes factor of 10, “significant” at 101/2, and “barely worth mentioning” at 1.
Other Images in This Article
Copyright and Terms & Conditions
© 2021. The Author(s). Published by the American Astronomical Society.