Image Details
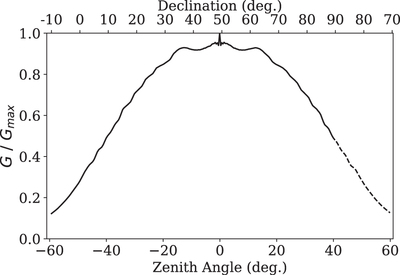
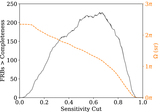
Caption: Figure 2.
Normalized band-averaged gain (intensity beam response) along meridian. Sensitivity is obtained with a composite beam model that includes primary and formed beam effects. Each point represents an average sensitivity within a synthesized beam’s 600 MHz FWHM. The dashed portion of the profile shows the lower transit. The sensitivity spike at zenith is a consequence of the beamforming technique (Ng et al. 2017).
Other Images in This Article
Copyright and Terms & Conditions
© 2021. The Author(s). Published by the American Astronomical Society.
Copyright ©
2025 Astronomy Image Explorer. All Rights Reserved.