Image Details
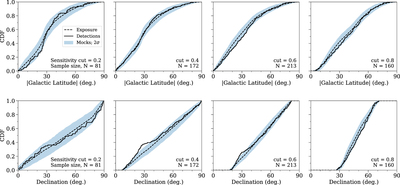
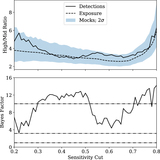
Caption: Figure 6.
Distributions of detection latitudes (empirical, solid lines) and exposure (cumulative, dashed lines). Absolute Galactic latitude is shown on the top row and decl. on the bottom. Each column corresponds to a different sensitivity cut and filtered sample of detections. Shaded regions are a 2σ band derived from an ensemble of simulated detections, where each mock sample includes the same number of bursts as the observed sample and is generated from the exposure CDF.
Other Images in This Article
Copyright and Terms & Conditions
© 2021. The Author(s). Published by the American Astronomical Society.
Copyright ©
2025 Astronomy Image Explorer. All Rights Reserved.