Image Details
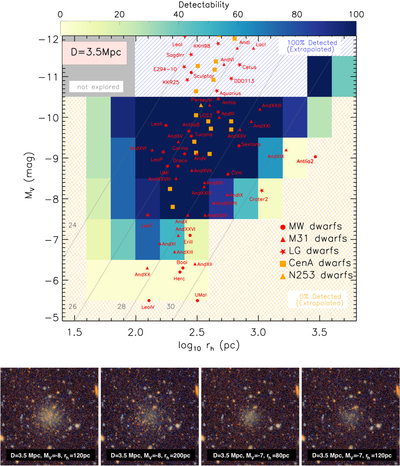
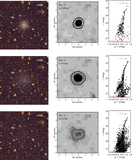
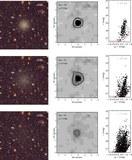
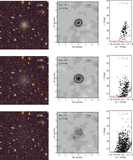
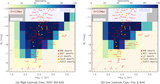
Caption: Figure 8.
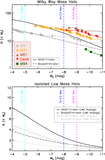
Top: results of our artificial resolved dwarf tests at a distance of 3.5 Mpc. It shows the size–luminosity space probed by our tests, along with known Local Group dwarfs (red symbols), Cen A dwarfs (orange squares), and NGC 253 dwarfs (orange triangles). Lines of constant V-band surface brightness are shown at 24, 26, 28, and 30 mag arcsec−2. The colored region shows a recovery completeness map for our simulated dwarfs in size–luminosity space. The blue hatched area at bright magnitudes denotes the approximate region where dwarfs should be easily detected (with ∼100% efficiency), while the orange hatched region corresponds to regions with little chance of dwarf detection (with a presumed 0% recovery); we have not explicitly explored these regions with our simulations. Bottom: RGB false-color images of example simulated faint dwarf galaxies. For each image cutout, the size is 1′ × 1′. Our experiments show that dwarfs as faint as these will be detectable out to 3.5 Mpc.
Other Images in This Article


Copyright and Terms & Conditions
© 2021. The American Astronomical Society. All rights reserved.