Image Details
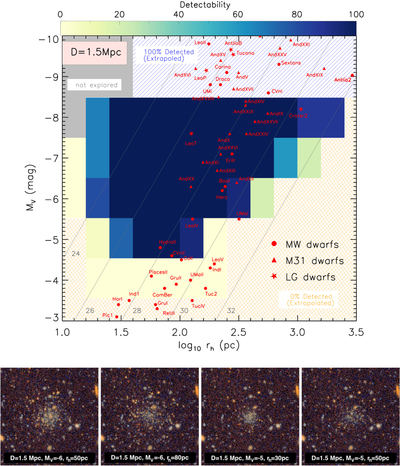
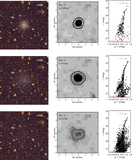
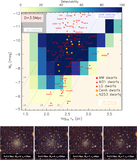
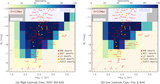
Caption: Figure 7.
Top: results of our artificial resolved dwarf tests at a distance of 1.5 Mpc. It shows the size–luminosity phase space probed by our tests, along with known satellites of the Local Group (circles, MW dwarfs; triangles, M31 dwarfs; stars, other Local Group dwarfs). Lines of constant V-band surface brightness are shown at 24, 26, 28, 30, and 32 mag arcsec−2. Colored regions show the recovery efficiency for our simulated dwarfs in size–luminosity space. The blue hatched area at bright magnitudes denotes the approximate region where dwarfs should be easily detected (with ∼100% efficiency), while the orange hatched region corresponds to regions with little chance of dwarf detection (with a presumed 0% recovery); we have not explicitly explored these regions with our simulations. Bottom: RGB false-color images of simulated ultrafaint dwarf galaxies. For each image cutout, the size is 1′ × 1′. Our experiments show that dwarfs as faint as these will be detectable at ∼1.5 Mpc.
Other Images in This Article

Copyright and Terms & Conditions
© 2021. The American Astronomical Society. All rights reserved.