Image Details
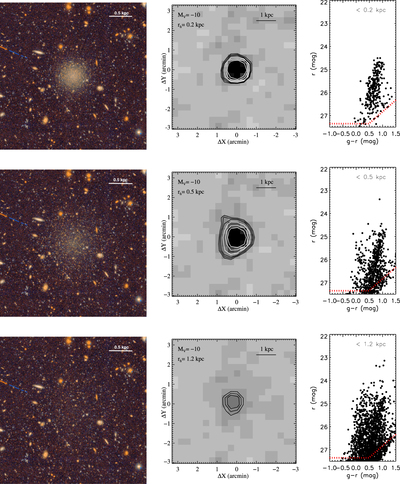
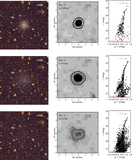
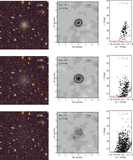
Caption: Figure 5.
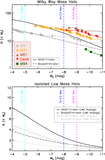
Example simulated resolved dwarfs with MV = −10 at 3.5 Mpc, with increasing physical sizes from top to bottom. The left panel displays false-color images. The middle panel is the smoothed matched-filter stellar density map, where we have spatially binned the input data and smoothed with a Gaussian of the width of the pixel size (20″). The contour levels show the 5σ, 6σ, 7σ, 10σ, 15σ, and 20σ levels above the modal value. Right: CMDs, including stars within one half-light radius. The red line represents the 50% completeness limit, i.e., r = 27.35 mag.
Other Images in This Article


Copyright and Terms & Conditions
© 2021. The American Astronomical Society. All rights reserved.
Copyright ©
2025 Astronomy Image Explorer. All Rights Reserved.