Image Details
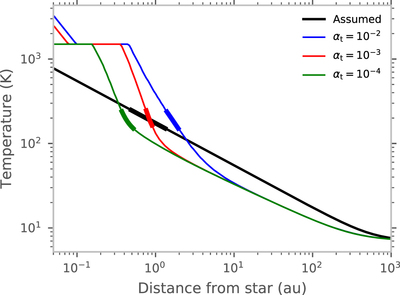
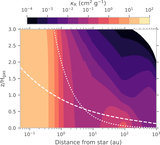
Caption: Figure 11.
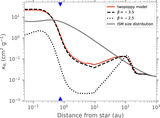
Post-processed temperature structure of the disk calculated using the method outlined in Birnstiel et al. (2010) with a self-consistent treatment of the opacity calculated using the size distribution and dust-to-gas ratio from our simulations. The disk properties at t = 1 Myr are used to calculate the temperature structure and taken from simulations for which vfrag is 1 and 10 m s−1 for ice-free and icy grains, respectively. The water-ice line (150–250 K) is marked with thick lines for each temperature profile.
Other Images in This Article
Show More
Copyright and Terms & Conditions
© 2021. The American Astronomical Society. All rights reserved.
Copyright ©
2025 Astronomy Image Explorer. All Rights Reserved.