Image Details
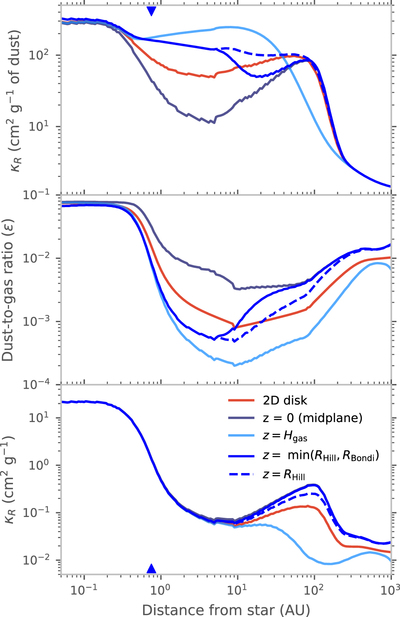
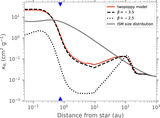
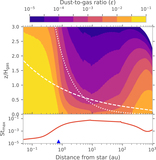
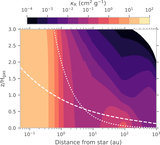
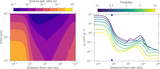
Caption: Figure 9.
Comparison of the Rosseland mean opacity per gram of dust, dust-to-gas ratio ϵ, and Rosseland mean opacity per gram of protoplanetary disk material κR for our fiducial 2D disk-integrated model and 3D disk model after 1 Myr of evolution. We plot the values of these quantities in the disk midplane (z = 0), a single gas scale height above the midplane (z = Hgas), and at heights of a 15 M⊕ planet’s RHill and min(RHill, RBondi) above the midplane. The water-ice line is marked with blue triangles.
Other Images in This Article
Show More
Copyright and Terms & Conditions
© 2021. The American Astronomical Society. All rights reserved.
Copyright ©
2025 Astronomy Image Explorer. All Rights Reserved.