Image Details

Caption: Figure 4.
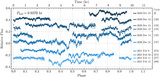
Left: the TESS Sector 4 (top) and Sector 31 (bottom) light curves phase-folded on the best-fit B-periods determined from each sector and vertically shifted for clarity. We again split each TESS light curve into first- and second-half components to display changes that occur throughout their ≈26-day durations. The amount of data contained within each phase-folded segment is shown to the left of each light curve in parentheses. Right: the corresponding periodograms of each TESS sector, where solid lines indicate the first-half light curves and dashed lines the second-half ones. Frequencies corresponding to the A- and B-periods (fA and fB) are marked with vertical dotted lines. In TESS Sector 31, the B-period underwent a significant reduction in amplitude from 2.3% ± 0.2% in the first half to 0.8% ± 0.2% in the second half.
Other Images in This Article
Copyright and Terms & Conditions
© 2021. The American Astronomical Society. All rights reserved.