Image Details

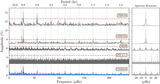
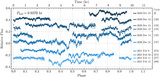
Caption: Figure 3.
Top: light curves from TESS (red and green triangles), ZTF (orange pentagons), HAO (blue open circles), JBO (purple stars), and McDonald Observatory (dark-blue circles) showing the total time baseline covered by each data set. The TESS Sector 31 data shown in this panel are binned into 10-minute exposures to reduce scatter. Bottom: light curves phase-folded on the best-fit A-period, 9.9370 hr, shown in rough chronological order from top to bottom, and labeled at right by their source. The TESS Sector 4 and 31 light curves are divided into first- and second-half segments to show changes in light-curve structure over their durations, while the ZTF data are divided into three groups by observing season. The HAO and McDonald data are grouped by month. For the ZTF light curves, we display the g-band (filled symbols) and r-band (open symbols) separately. Each light curve has been vertically shifted for clarity, and two full phases have been plotted.
Other Images in This Article

Copyright and Terms & Conditions
© 2021. The American Astronomical Society. All rights reserved.