

Image Details
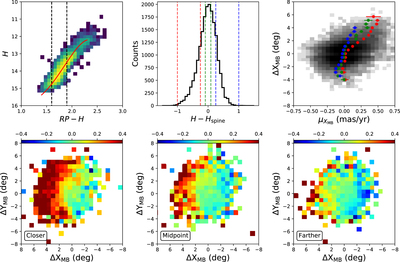
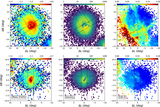
Caption: Figure 19.
Upper left: CMD of SMC giants within a fixed metallicity range of ﹩-1\lt \left[\mathrm{Fe}/{\rm{H}}\right]\lt -0.9﹩ dex. The solid red line shows the polynomial fitted to the RGB in this bin, offsets from which are taken as a proxy for heliocentric distance. As described in the text, we have fitted such polynomials to SMC giants lying in the range ﹩-1.2\lt \left[\mathrm{Fe}/{\rm{H}}\right]\lt -0.5﹩ dex, over metallicity bins of width 0.1 dex. In computing the magnitude offset of our giants, we only consider those falling between the black dashed lines in the panel. Upper middle: we show the distribution of the magnitude offset of the SMC giants we select to analyze. The distribution is centered about zero and appears to be relatively symmetric about its peak, with a slight tail to negative values with these stars likely lying in front of the dwarf. Three bins in this distance proxy were selected to study the behavior of giants lying in front of, coincident with, and behind the center of the SMC. The boundaries of these bins are shown by the red, green, and blue dashed lines, respectively. Upper right: grayscale pixels show the logarithmic density of stars in their relative offset from the SMC center as a function of their motion in ﹩{\mu }_{{X}_{\mathrm{MB}}}﹩. There is a distinct population of stars with excessive motion in ﹩{\mu }_{{X}_{\mathrm{MB}}}﹩ along increasing ΔXMB, toward the LMC. The scatter points are colored by their respective distances and show mean proper motion values as a function of ΔXMB. We see that it is those giants lying predominantly in front of the SMC who exhibit such perturbed motion. This sequence becomes distinct in its behavior very centrally and rapidly evolves out to high values of ﹩{\mu }_{{X}_{\mathrm{MB}}}﹩ with increasing angular distance away from the SMC core. Error bars represent the standard error weighted by the Poisson noise in each bin. Lower panels: we show the SMC giants in the three distance bins, with the closest in the left panel and the most distant in the right. Pixel colors correspond to mean values of ﹩{\mu }_{{X}_{\mathrm{MB}}}﹩. This view of the SMC reinforces the result of the upper-right panel, where we can clearly see the giants lying closer to us being those most heavily disrupted in the direction of the LMC.
Other Images in This Article
Show More
Copyright and Terms & Conditions
© 2021. The American Astronomical Society. All rights reserved.

