

Image Details
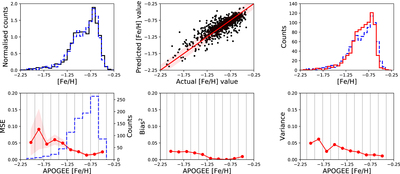
Caption: Figure 6.
Upper-left panel: training data metallicity distribution in black solid line which is adequately representative of the test data distribution shown as the blue dashed line. Upper-middle panel: scatter plot of the predicted and APOGEE measured metallicities for the stars in our test set. The solid red line indicates a one-to-one correspondence, and the red shaded region bounds the RMSE of 0.15 dex recovered from the test set analysis. The majority of the scatter is present at the lowest of metallicities where the stellar density is extremely low. Upper-right panel: the blue dashed line indicates the test set’s true metallicity distribution now overlaid with the predictions in solid red. Generally, the overall distribution is reproduced well. Lower left: the red line shows the estimated MSE binned by APOGEE metallicity values of our test data. The filled shaded region bounding this line shows the dispersion of this value weighted by the Poisson noise in each bin. The blue histogram shows the metallicity distribution of the test set in question, with the faint gray vertical lines indicating the bin edges. At metallicities less than ∼−1.2 dex, the corresponding RMSE is 0.23 dex. Lower middle: the squared bias in each metallicity bin is seen to be relatively low across the full range, with the greatest contribution being at the metal-poor end. Lower right: the variance of the predictions in each bin is shown. The largest contribution to total error is again seen at the metal-poor end owing to the dearth of training data in this region.
Other Images in This Article
Show More
Copyright and Terms & Conditions
© 2021. The American Astronomical Society. All rights reserved.

