

Image Details
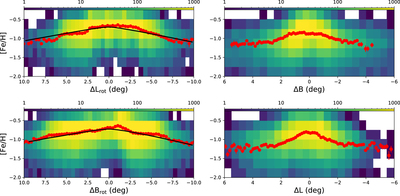
Caption: Figure 11.
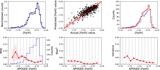
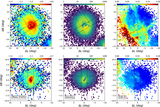
Stellar density maps tracing the metallicity profile along directions aligned with the projected axes of the bars. The left two panels correspond to the LMC and the right panels to the SMC. The top (bottom) row shows the profile of stars that fall within the dashed (dotted) line in Figure 9. In the case of the LMC, we have rotated the Magellanic Stream coordinate system clockwise by 30° so as to approximately align with the major axis of the bar. We only consider stars with ﹩\left\langle {D}_{{NN}}\right\rangle \lt 0.06﹩ in this figure. Red markers correspond to mean metallicity binned over angular offset relative to each Cloud’s center, with error bars representing standard errors in each bin. Both the LMC and SMC show a flattening in the metallicity profile centrally in the domain of the bar. Clear negative gradients are observed on increasing distance away from the central regions, with strong asymmetries and plateau-like features present.
Other Images in This Article
Show More
Copyright and Terms & Conditions
© 2021. The American Astronomical Society. All rights reserved.

