Image Details
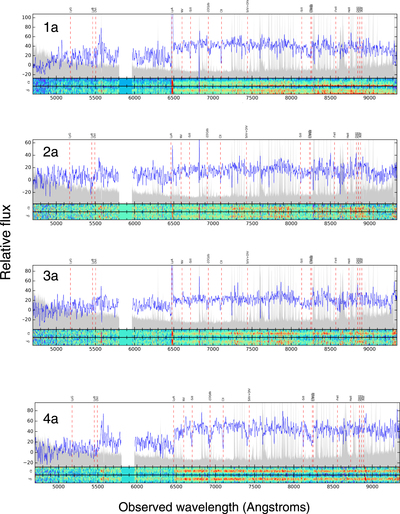
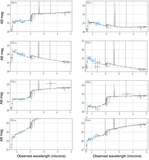
Caption: Figure 2.
VLT/MUSE 1D spectra of the four main galaxy members of the group associated with the ALMA source. For each source, we show the spectrum of highest S/N ratio among those corresponding to the different lensing images. Sources ID #1 and #3 clearly have Lyα in emission. Source ID #4, which is the closest to the ALMA source, has Lyα in absorption and displays a very prominent Lyman break in its spectrum. The shape of the Lyα line is less clear for source ID #2, as it is contaminated by a sky line. The pseudo-2d spectra at the bottom of each panel are extracted in square apertures with a 3.2 arcsec side (i.e., 16 MUSE pixels) and projected in the R.A. (alpha) and decl. (delta) directions as indicated in the y-axis of the figures.
Other Images in This Article
Copyright and Terms & Conditions
© 2021. The American Astronomical Society. All rights reserved.