Image Details
Caption: Figure 1.
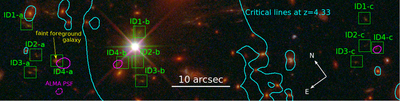
HST color image showing the three lensed images of the MUSE/ALMA galaxy group at z = 4.32 behind the massive galaxy cluster El Gordo at z = 0.87 (green squares). The regions with ALMA continuum emission (corresponding to the three images of the ALMA source) are delimited with magenta solid lines, while the ALMA beam size is indicated with a magenta dashed-line contour. The critical lines from the strong-lensing best-fit model at z = 4.33 are also shown (cyan contours). The sources labeled as #5 and #6 in Table 1 are out of the field shown in this figure.
Other Images in This Article
Copyright and Terms & Conditions
© 2021. The American Astronomical Society. All rights reserved.
Copyright ©
2025 Astronomy Image Explorer. All Rights Reserved.