Image Details
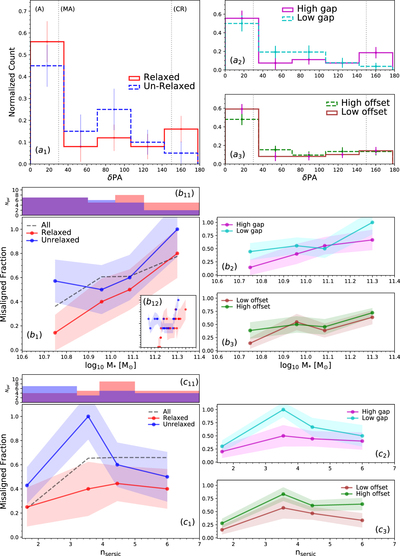
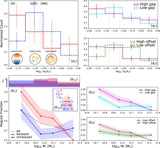
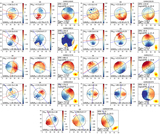
Caption: Figure 7.
Top: distribution of the star–gas misalignment PA, δPA, for BGGs for relaxed/unrelaxed (panel (a1)), high/low gap (top right panel (a2)), and low/high offset (bottom right panel (a3)) groups. Errors are standard deviation (1σ) errors calculated using the bootstrap method. Vertical dotted lines show δPA of 30° and 150° that we used for discriminating between alignment/misalignment (A/MA) and contour rotating (CR) BGGs, respectively. Middle: fraction of misaligned δPA as a function of stellar mass for BGGs, separated into the subsamples (b1, b2, b3) given in the legend. Dashed lines show the median trend for all BGGs in our sample. In each panel, the errors (color-shaded lines) are 1σ confidence intervals on the fractions calculated using the bootstrap method. Along the upper x-axis of the panel (b11), we show the stellar mass distribution of relaxed and unrelaxed in the bins (Ngal) in order to present the statistics in each data point. Inset figure in the left panel (b12) shows the median fraction of misaligned δPA BGGs as a function of stellar mass using the moving average method with standard deviation error, where the axes range is the same as in the main panel. Bottom: Fraction of misaligned δPA as a function of BGGs Sérsic index (c1, c2, c3), nSersic, with the same description as given in the middle panel.
Other Images in This Article
Show More
Copyright and Terms & Conditions
© 2021. The Author(s). Published by the American Astronomical Society.