Image Details
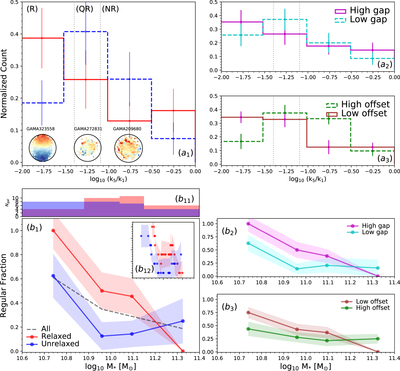
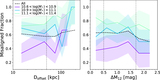
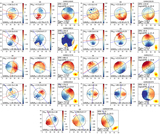
Caption: Figure 4.
Top: distribution of the kinematic asymmetry (k5/k1) with standard deviation (σ) errors calculated by the bootstrap method for BGGs in relaxed (red) and unrelaxed (blue) group in the left panel (a1), and high/low gap and low/high offset groups in the top (a2) and bottom (a3) right panels, respectively. The fraction of nonregular (NR) rotators (k5/k1 > 0.08), quasi-regular (QR) (0.04 < k5/k1 < 0.08), and regular (R) rotating (k5/k1 ≤ 0.04) (dotted lines; van de Sande et al. 2017) are presented in Table 1 for the BGGs that reside in subsample groups. Representative stellar kinematic maps of BGGs defined as NR, QR, and R rotators are shown in the corresponding regions. Bottom: the fraction of regular BGGs as a function of stellar mass, separated by the subsample indicated in the legend (panels (b1), (b2), (b3)). Dashed line shows the median trend for all BGGs in our sample. In each panel, the errors (color-shaded lines) are σ confidence intervals on the fractions calculated using the bootstrap method. In the histogram along the upper x-axis of the panel (b11), we show the number of galaxies (Ngal) in each stellar mass data point for the relaxed and unrelaxed samples. Inset figure in the left panel (b12) shows the median fraction of regular rotation BGGs as a function of stellar mass using the moving average method where the axes range is the same as in the main plot.
Other Images in This Article
Show More
Copyright and Terms & Conditions
© 2021. The Author(s). Published by the American Astronomical Society.