Image Details
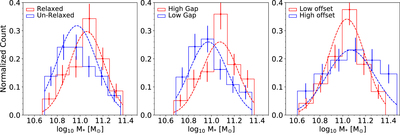
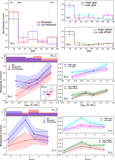
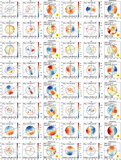
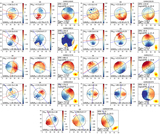
Caption: Figure 2.
Distribution of stellar mass with Poisson errors for all subsamples considered in this study, including relaxed/unrelaxed, high/low gap, and low/high offset, as shown by red/blue color in each panel from left to right. Dashed lines show the Gaussian fit to each distribution.
Other Images in This Article
Show More
Copyright and Terms & Conditions
© 2021. The Author(s). Published by the American Astronomical Society.
Copyright ©
2025 Astronomy Image Explorer. All Rights Reserved.