Image Details
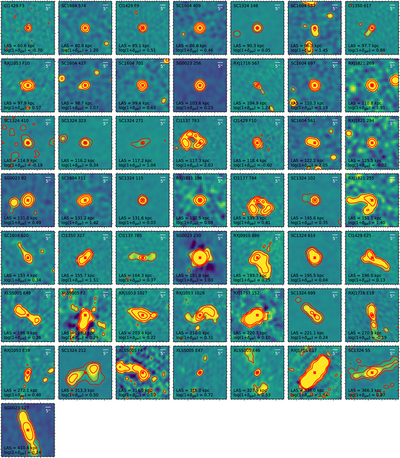
Caption: Figure 1.
Radio cutouts of ERAGN ranked by their radio size in ascending order. Images are 50″ × 50″ (400 × 400 kpc at z = 1) indicated by the scale bar in the upper right corner, and are centered on the centers of radio sources that are marked by red crosses. North is up and east is to the left. The contours levels are 4, 16, and 64σ. The labels are field name plus radio id in the upper left, and LAS and local overdensity values in the lower left.
Other Images in This Article
Copyright and Terms & Conditions
© 2020. The American Astronomical Society. All rights reserved.
Copyright ©
2026 Astronomy Image Explorer. All Rights Reserved.