Image Details
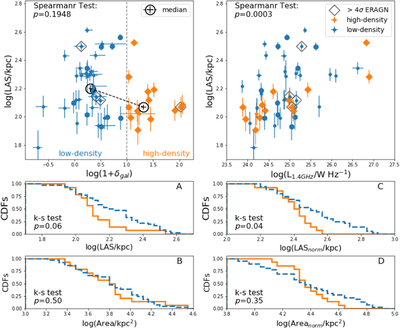
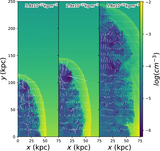
Caption: Figure 3.
Left top: the LAS vs. the local overdensity for low- and high-density ERAGN samples in blue dots and orange diamonds, respectively. Larger markers are ERAGN having spectroscopically confirmed redshifts. Four ERAGN using >4σ contours to measure their LAS, due to blending (see Section 2.3), are marked by black diamonds in the top two panels. The black dots are the median of the log(LAS) and log(1 + δgal) of low- and high-density ERAGN with error on median. The vertical dashed line shows the separation of low- and high-density at log(1 + δgal) = 1. The median of log(LAS) of the high-density sample is lower than that of the low-density at 4.5σ significance level. Right top: The LAS vs. the radio power for the low- and high-density ERAGN samples. The significance of the Spearman test (pSpearmanr) for the full ERAGN sample is shown in the top two panels, which suggests a correlation between the radio power and size, but no correlation between the local overdensity and size. Bottom: CDFs of log(LAS) (A), log(Area) (B), radio power normalized LAS (LASnorm; C) and area (Areanorm; D) for the low- and high-density ERAGN, in blue dashed and orange lines, respectively. Both p values for the LAS and LASnorm suggest that the size distributions of low- and high-density ERAGN are drawn from different underlying populations, while it is inconclusive in the area comparisons.
Other Images in This Article
Copyright and Terms & Conditions
© 2020. The American Astronomical Society. All rights reserved.