Image Details
Caption: Figure 4.
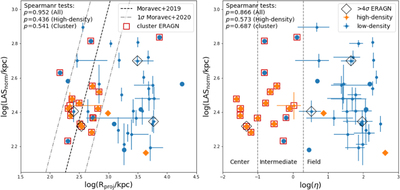
The log(LASnorm) vs. the distance from the cluster center (Left) and global environment η (Right) for the low-density ERAGN in blue dots and high-density ERAGN in orange diamonds. ERAGN within clusters/groups (cluster-ERAGN, log(η) ≤2) are marked with red open boxes. The errorbars on Rproj and log(η) of ERAGN-phot are derived based on the uncertainty of zphot (see Appendix A). Larger markers are ERAGN having spectroscopically confirmed redshifts. Four ERAGN using >4σ contours to measure their LAS, due to blending (see Section 2.3), are marked by black open diamonds in both panels. The black dashed line is the relationship from Moravec et al. (2019), along with 1σ (gray dashed lines) derived from the full sample in Moravec et al. (2020). The cluster/group center, the intermediate and field regions are separated by the vertical dashed lines. The p values of the Spearman rank correlation tests of the full, high-density, cluster-hosted ERAGN samples are shown in the upper left corner of each panel. None of them shows a noticeable correlation.
Other Images in This Article
Copyright and Terms & Conditions
© 2020. The American Astronomical Society. All rights reserved.