Image Details
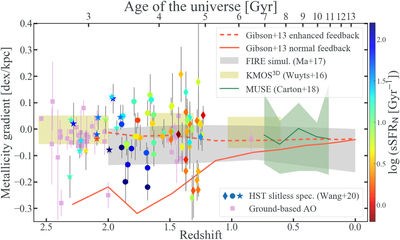
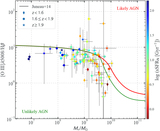
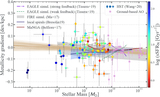
Caption: Figure 8.
Overview of metallicity gradients in the distant universe. Our measurements are represented by three symbols, corresponding to different z ranges as in Figure 4, color-coded in sSFR. As a comparison, we also include individual measurements at similar resolution (≲kpc scale) from ground-based AO-assisted observations, marked by magenta squares (Swinbank et al. 2012; Jones et al. 2013; Leethochawalit et al. 2016; Förster Schreiber et al. 2018). The 2σ spreads of measurements from KMOS3D (Wuyts et al. 2016) and MUSE (Carton et al. 2018) and the simulation results from FIRE (Ma et al. 2017) are shown as shaded regions in green, yellow, and gray, respectively. The evolutionary tracks of two simulated disk galaxies (Milky Way analogs at z ∼ 0) with different feedback strengths but otherwise identical numerical setups are denoted by the two orange curves.
Other Images in This Article
Copyright and Terms & Conditions
© 2020. The American Astronomical Society. All rights reserved.