Image Details
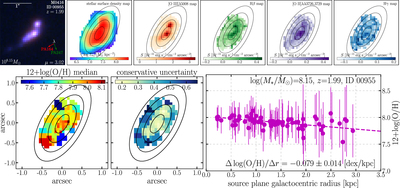
Caption: Figure 7.
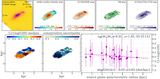
A z ∼ 2 star-forming dwarf galaxy (﹩{M}_{* }﹩ ≃ 108 ﹩{M}_{\odot }﹩) with a negative metallicity radial gradient, similar to that measured in our Milky Way (i.e., −0.07 ± 0.01; Smartt & Rolleston 1997). We show this as an example of the analysis procedures applied to our entire sample. Top, from left to right: color-composite stamp (from the HFF imaging), stellar surface density (﹩{{\rm{\Sigma }}}_{* }﹩) map (obtained from pixel-by-pixel SED fitting to HFF photometry), and surface brightness maps of emission lines ﹩[{\rm{O}}\,{\rm\small{III}}]﹩, Hβ, ﹩[{\rm{O}}\,{\rm\small{II}}]﹩, and Hγ. We use the technique demonstrated in Figure 3 to obtain pure ﹩[{\rm{O}}\,{\rm\small{III}}]﹩ λ5008 and Hβ maps for the source. The black contours mark the delensed, deprojected galactocentric radii with 1 kpc intervals given by our source-plane morphological reconstruction described in Section 3.6. Bottom: metallicity map and radial gradient determination for this galaxy. The weighted Voronoi tessellation technique (Cappellari & Copin 2003; Diehl & Statler 2006) is adopted to divide the surface into spatial bins with a constant S/N of 5 on ﹩[{\rm{O}}\,{\rm\small{III}}]﹩. In the right panel, the metallicity measurements in these Voronoi bins are plotted as magenta points. The dashed magenta line denotes the linear regression, with the corresponding slope shown at the bottom. The spatial extent and orientation remain unchanged throughout all of the 2D maps in both rows, with north up and east to the left.
Other Images in This Article
Copyright and Terms & Conditions
© 2020. The American Astronomical Society. All rights reserved.