Image Details
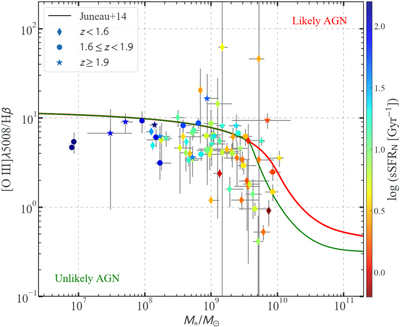
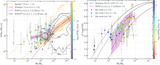
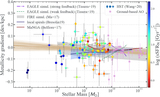
Caption: Figure 4.
Mass-excitation diagram for our galaxies. The demarcation curves are from Juneau et al. (2014) based on the z ∼ 0 SDSS DR7 emission line sample; AGNs are located mainly above the red curve, star-forming galaxies are located below the green curve, and AGN/star-forming composites are in between. Our entire sample is separated into three redshift bins: z < 1.6 (37 sources), 1.6 ≤ z < 1.9 (24 sources), and z ≥ 1.9 (15 sources), color-coded in sSFR. We show that the majority of our sources are located below the green curve, where the possibility of being classified as AGNs is low (<10%).
Other Images in This Article
Copyright and Terms & Conditions
© 2020. The American Astronomical Society. All rights reserved.
Copyright ©
2025 Astronomy Image Explorer. All Rights Reserved.