

Image Details
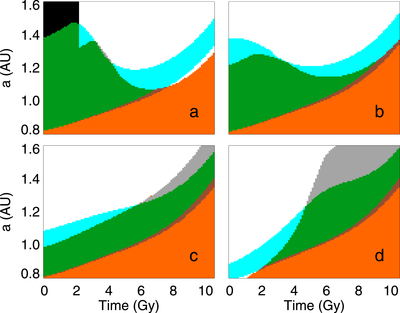
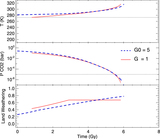
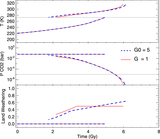
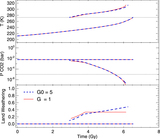
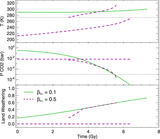
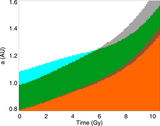
Caption: Figure 15.
Different climate states as a function of the relationship between seafloor weathering and outgassing. The colors have the same meanings as in Figure 9. In each panel, the seafloor-weathering rate is proportional to Gn, where G is the outgassing rate. Panels (a)–(d) use n = 0, 0.5, 1, and 2, respectively. In all cases, the outgassing rate declines exponentially over time with G0 = 5.
Other Images in This Article
Show More
Copyright and Terms & Conditions
© 2020. The American Astronomical Society. All rights reserved.

Copyright ©
2026 Astronomy Image Explorer. All Rights Reserved.
